The University has organized its Civil Service and P&A employee roles into broad job families. The job families represent similar types of roles and duties across the University. For employees, the job families establish clearly defined career paths and transparent pay structures across the University system.
To find salary information for a particular job, first determine the position's job code (including the two-letter extension, if applicable) using the charts under "Job Family Structure" below. Then click on "Search for a Job Classification" and use the Job Classification Search to look up the salary information for that job code.
Job Family Information
Job Family Structure
To see the job family structure for your position, visit one of these links:
- Academic (Excel)
- Administration (Excel)
- Advancement (Excel)
- Animal Health (Excel)
- Athletics (Excel)
- Audit (Excel)
- Business Development (Excel)
- Campus Operations (Excel)
- Education (Excel)
- Finance (Excel)
- Grants and Contracts (Excel)
- Health Care (Excel)
- Human Resources (Excel)
- Information Technology (Excel)
- Legal (Excel)
- Libraries (Excel)
- Marketing and Communications (Excel)
- Museums (Excel)
- Recreation (Excel)
- Research (Excel)
- Student Services (Excel)
Salary Ranges by Job Family
After using the Job Family Structure charts to determined the job code for a particular job (including the two-letter extension, if applicable), look up the salary information using this spreadsheet: Job Family Salary Ranges FY2027 (Excel)
Search for a Job Classification
A job classification specification includes an overview of the type and level of responsibilities within a specific job code, and classification attributes such as salary range, job family, job code group, and required qualifications.
Job Family Definitions
Annual Salary Structure Updates
Each year on January 1, we adjust our salary structure for jobs in families that have gone through market refinements. This annual adjustment ensures that our salary range midpoints continue to reflect the median compensation rates in the external market for our jobs.
Although budget constraints limit the size and number of salary increases that can be awarded, we believe accurate awareness of the new ranges and external market is critical for managers to assess competing demands for limited financial resources and make optimal pay decisions.
We have created an online dashboard you may use to review the compensation for your employees in refined job families. Although this report will be able to be accessed here all year, please note the data in the dashboard will only be refreshed January 31, 2024.
A report will display that includes your direct and indirect reports who are in refined jobs families.
You can use this report for the following:
- Compare the former and new range midpoint for each employee to see how the market moved for the job they are in. You can also see how this market movement affected the employee’s compa-ratio.
- Check to see if the salary grade for any of your employees went up to a higher grade. This will be highlighted in purple and indicates that the market for this job moved more quickly than the market in general.
- Check to see if the salary grade for any of your employees went down to a lower grade. This will be highlighted in blue and indicates that the market for this job dropped from last year.
- Identify employees who will be receiving increases to bring their salaries to the new range minimums, highlighted in red.
- Make note of employees with compa-ratios below 0.75. These employees are in jobs that have salary range minimums that will be phased upwards over time. We encourage you to give extra consideration to these employees when allocating salary increases, with the goal of eventually getting them to a compa ratio of at least .75.
- Make note of any employees with compa-ratios above 1.25. These employees are currently paid above the salary range maximum for their job code. They should receive their annual increase, if one is provided, in the form of a lump sum payment until their salary falls within the pay range.
Below are details on how to navigate within your report: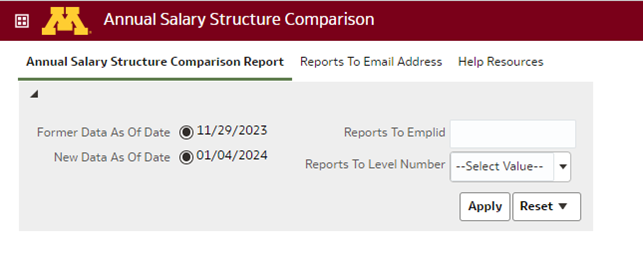
After selecting the link, to access a report for your staff, enter your personal employee ID in the “Reports to Emplid” box and select “Apply.”
A report will display that includes your direct and indirect reports who are in refined job families. Staff in families that have not been refined as well as union employees will not display.
After January 31, 2024, we recommend that you access compa-ratio information on the Employee Compa Ratio dashboard which can be accessed in MyU Reporting Center.
Again, this information is being provided for your awareness and for compensation planning purposes. Please contact your college or unit HR department if you have any questions about your report.
Troubleshooting Tips
Here are fixes for two common issues when accessing the online compensation dashboard.
Common Error #1: Bad Message 431
The Bad Message 431 error is often related to browser cache issues. To address this problem, please follow the instructions below to clear your browser cache before attempting to access the dashboard again.
Instructions for several browsers are listed below:
After clearing your browser cache, please refresh the online compensation dashboard.This should resolve the Bad Message 431 error.
Common Error #2: “This page has no content”
When accessing the online compensation dashboard, you may land on a blank page with a message that reads, “This page has no content.”
To access the dashboard from this page, please follow these steps:
Click “Open” in the top-right corner.
Beneath “Recent,” click on “Annual Salary Structure Comparison - Annual Salary Structure Comparison Report.”