In the Dashboard, the following options are available for viewing the employee engagement results:
- Key Metrics
- Engagement Profile
- Results by Key Metrics and Drivers
- Question Sorting Tool
Option details
Key Metrics
The employee engagement survey has two key metrics: Commitment & Dedication and Effective Environment. Each key metric has corresponding drivers.
Commitment & Dedication represent employees' commitment, motivation, and pride for their work and the organization and their willingness to provide extra effort in their work when it matters to them.
Effective Environment represents conditions that allow employees to be effective in their jobs and remove barriers to their productivity.
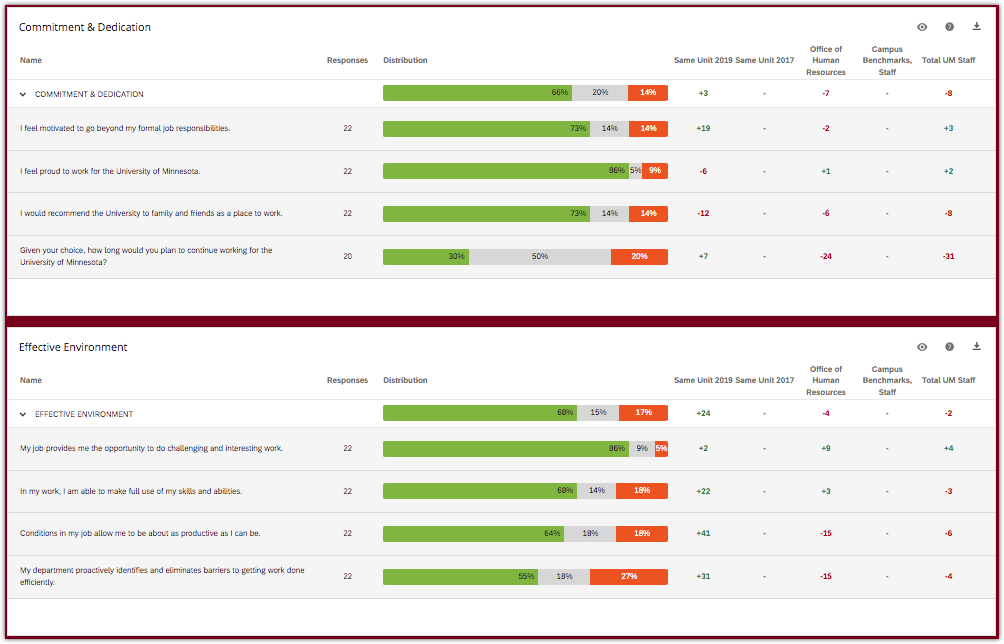
Results are compared to the trend data for your unit (when available) as well as to the internal benchmark data for the University.
Engagement Profile
The two key metrics of Commitment & Dedication and Effective Environment do not always go hand in hand. The Engagement Profile identifies four distinct groups of employees in organizations, characterized by differing levels of motivation and support: engaged, disengaged, frustrated, and detached.
This profile is generated from eight survey items which are shown on the Key Metrics tab (see above). There are four items for Commitment & Dedication and four items for Effective Environment.
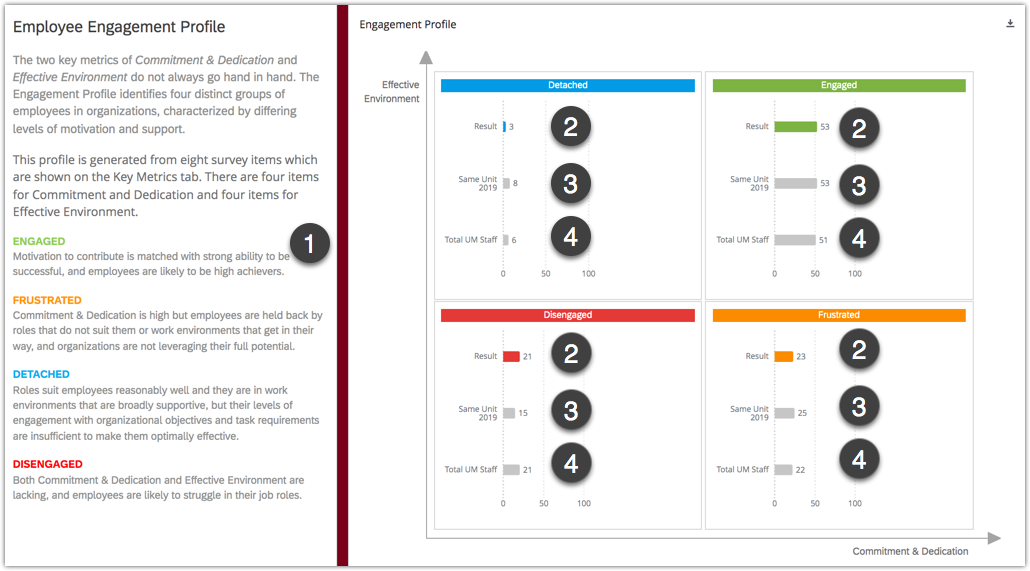
- (1) - Quadrant definitions for Engaged, Frustrated, Detached, and Disengaged categories
- (2) - Current results, shown as percentages of your total team
- (3) - Your 2021 data (when available)
- (4) - Current results for the U of M system
A blank Engagement Profile indicates there is not enough data for it to be generated.
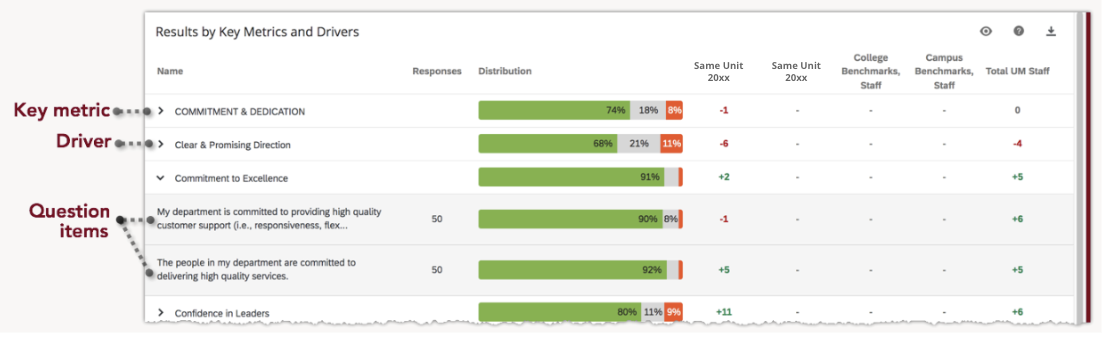
Results by Key Metrics and Drivers
On this page you can view all survey questions grouped by Key Metrics and Drivers. Note that the survey Key Metrics are in capital letters.
To view the questions that make up each Metric/Driver score, just expand by clicking the arrow (>) next to the name of the Metric/Driver, or simply click on the Metric/Driver name.
Question Sorting Tool
This page contains all multiple-choice questions in the survey. You can click any column header to sort. Clicking the same header again reverses the direction of the sort.
By default, all questions are sorted from the highest to lowest Favorable (green) score.
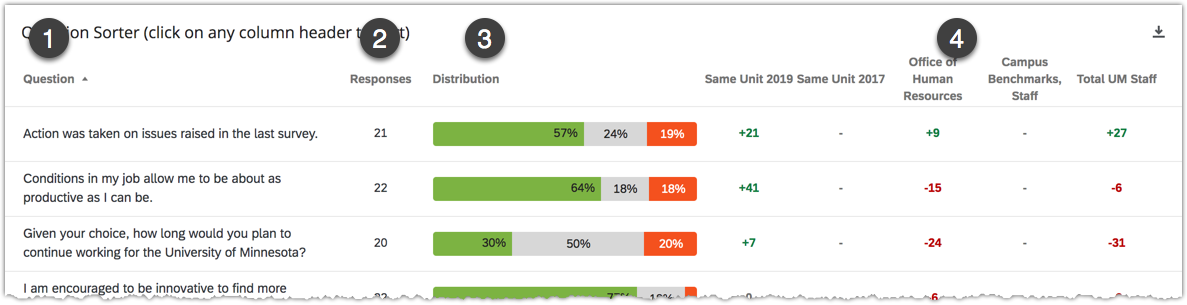
Sorting by:
- (1) Question - arrange the question in alphabetical order.
- (2) Responses - arrange the results by the number of people who responded to a particular question
- (3) Distribution - arrange questions from the highest to lowest Favorable (green) score. The reverse shows the lowest to highest Favorable (green) score.
- (4) Comparison columns (Same Unit 2021, Same Unit 2019, College Benchmarks, Campus Benchmarks, and Total UM) - arrange questions by how their current scores compare to a particular comparison column